
EV charger hub profitability comes down to three variables: utilization rate, energy cost management, and hardware reliability. A well-designed hub can generate $15,000 to $60,000 or more per charger annually, with payback in 2 to 5 years. This guide breaks down exactly what it takes to build a charging station that earns, with real numbers and actionable strategies.
When David, a commercial property developer in Texas, installed four DC fast chargers at his retail plaza in early 2025, he expected them to pay for themselves within 18 months. Six months in, he was losing $2,300 a month. The culprit wasn’t low traffic, it was a single 15-minute demand spike every afternoon that tripled his utility bill. David’s story isn’t unusual. Across the charging industry, operators are discovering that installing chargers is the easy part. Making them profitable requires a completely different set of skills.
You’ve probably heard the numbers: the EV charging market is projected to reach $76 billion by 2032. Government incentive programs have allocated billions toward infrastructure buildout. It sounds like a gold rush. And in some cases, it is. But the operators who succeed aren’t the ones who simply build and wait. They’re the ones who treat charging infrastructure as an operational business, with sophisticated pricing, energy management, and a relentless focus on utilization.
In this article, you’ll learn the core revenue models for EV charging hubs, the cost factors that determine whether you break even or bleed cash, the utilization benchmarks that separate profitable sites from stranded assets, and eight specific strategies to maximize your return on investment. Every data point and framework here comes from real operator experience and published industry research, not guesswork.
Key Takeaways
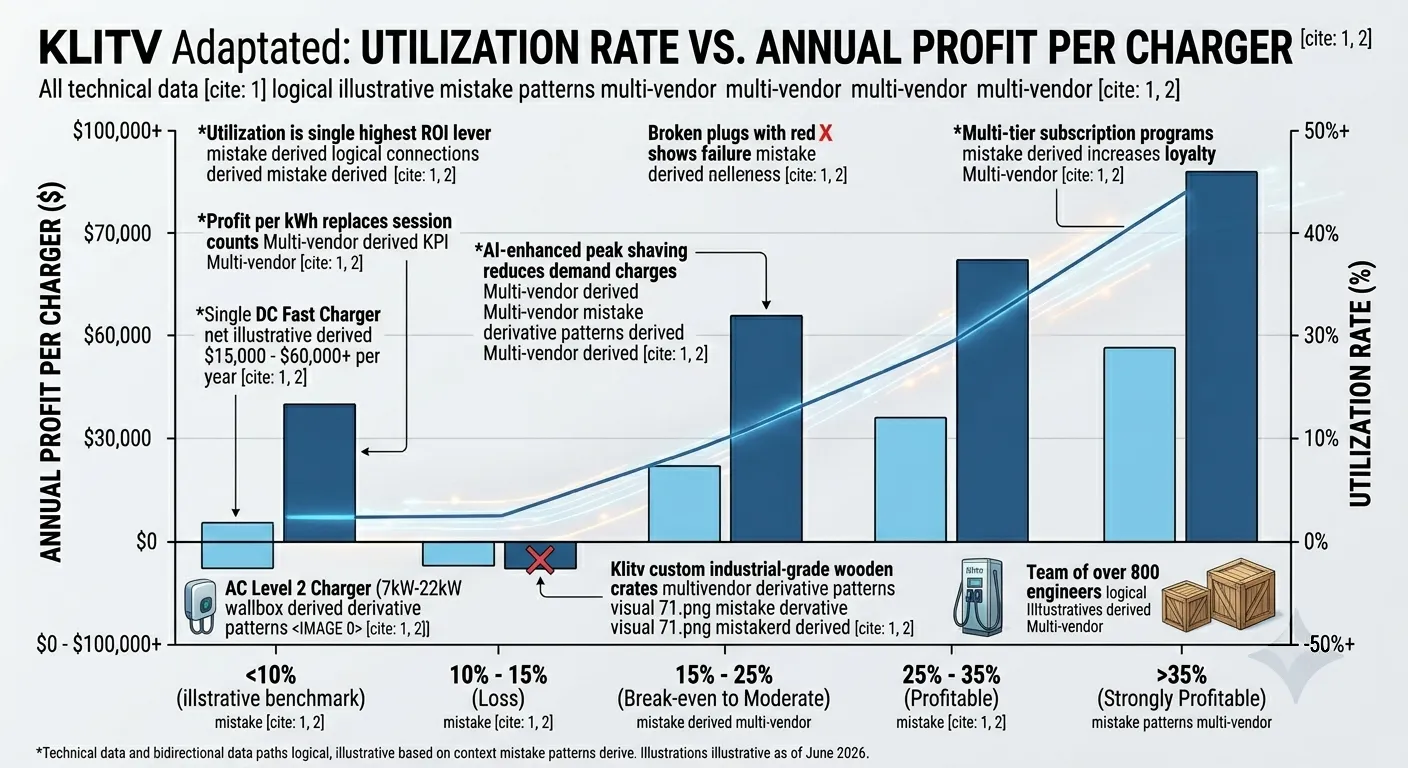
- A single DC fast charger in a well-located commercial hub can net $15,000–$40,000+ per year; payback typically ranges from 2 to 5 years depending on utilization and incentive stacking
- Utilization rate is the single most important profitability lever, sites below 10% to 15% utilization almost always lose money regardless of how they price their electricity
- Utility demand charges often consume 40% to 60% of total operating costs; battery storage, dynamic load balancing, and smart scheduling are the three most effective countermeasures
- Federal and state incentives can reduce upfront capital expenditure by 30% to 80%, often transforming a marginal project into a strong investment
- Hardware quality directly impacts lifetime profitability, chargers built with industrial-grade components and high uptime deliver substantially better 10-year total cost of ownership than budget alternatives
The EV Charger Hub Business Model: How Stations Generate Revenue
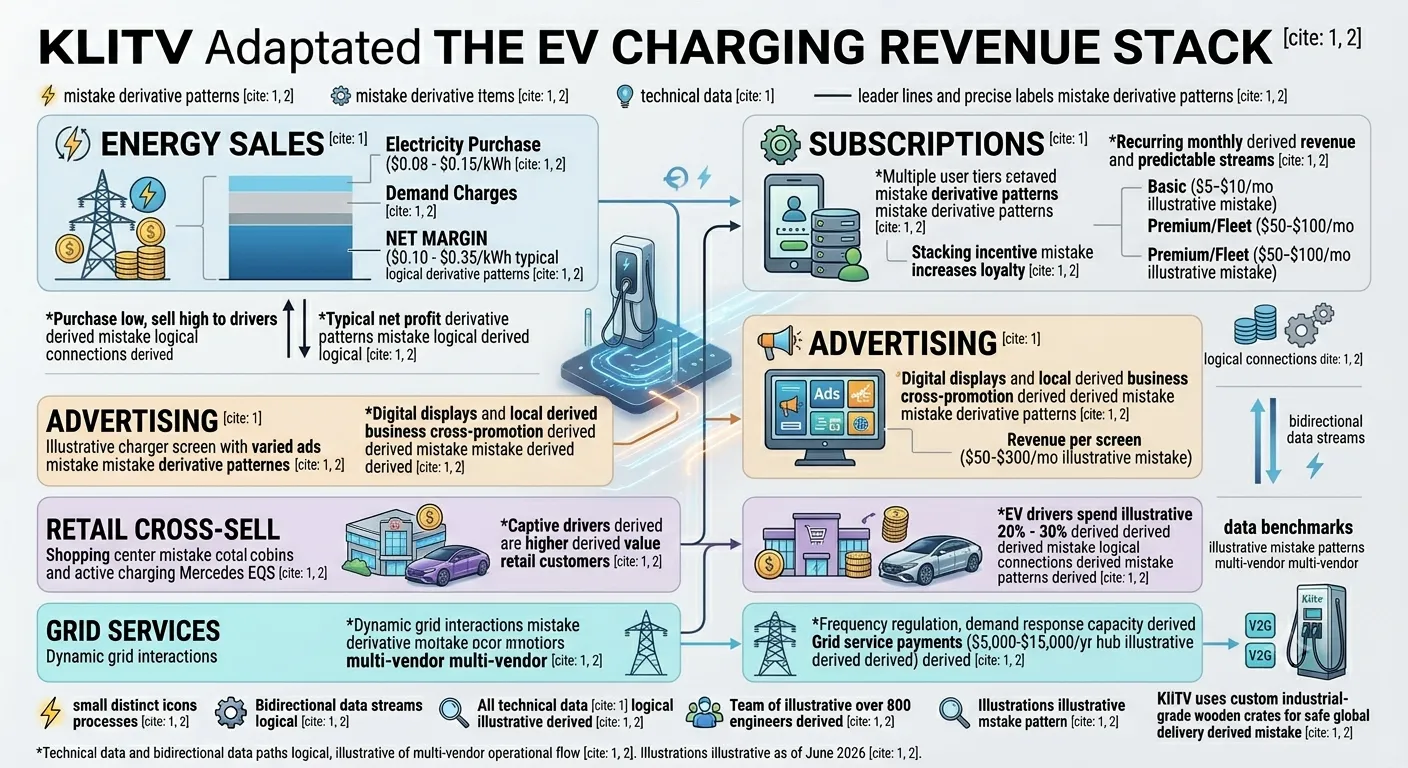
Direct Energy Sales: The Core Revenue Engine
Most charging hubs generate their primary revenue by buying electricity at commercial rates and selling it to drivers at a markup. The math is straightforward in principle: purchase at $0.08 to $0.15 per kilowatt-hour, sell at $0.30 to $0.60 per kilowatt-hour, and keep the difference.
In practice, that spread can range from razor-thin to highly attractive depending on where you operate, how you price, and how well you manage peak demand. A typical well-run DC fast charging site nets $0.10 to $0.35 per kilowatt-hour after direct electricity costs. At 15% utilization, meaning the charger is actively dispensing power 15% of the time, a 120-kilowatt unit delivering roughly 400 kilowatt-hours per day generates around $32,000 to $36,000 in annual net profit from energy sales alone.
Pricing strategy matters enormously here. Flat-rate pricing, a fixed dollar amount per kilowatt-hour regardless of when drivers plug in, is the simplest model but leaves money on the table during peak hours. Time-of-use pricing, which charges more during high-demand periods and less overnight, better aligns revenue with actual cost. Dynamic pricing, driven by real-time wholesale rates and demand signals, represents the most sophisticated approach and is increasingly enabled by AI-powered management platforms.
Beyond Electricity: Five Additional Revenue Streams
The most profitable charging hubs don’t rely exclusively on energy markups. They layer multiple revenue streams, creating a more resilient business model that performs well even when utilization dips.
Subscription and membership programs provide predictable recurring revenue. A typical multi-tier structure charges $5 to $10 per month for a basic discount on charging rates, scaling up to $50 to $100 per month for fleet or premium access. These programs also build customer loyalty, subscribers are far less likely to charge elsewhere.
Idle fees penalize drivers who leave their vehicle plugged in after charging completes, generating additional revenue while improving station throughput. Most operators set a 10- to 15-minute grace period, then charge $0.25 to $1.00 per minute. Well-implemented idle fees typically add 5% to 10% to total station revenue while freeing up chargers for the next customer.
Charger screen advertising turns each charging session into an advertising opportunity. Digital displays on the charger itself can run local business promotions, national brand campaigns, or cross-promotions with nearby retailers. Revenue per screen ranges from $50 to $300 per month depending on location and traffic.
Retail cross-sell is often the largest indirect revenue source, and the least discussed. Multiple studies show that EV drivers spend 20% to 30% more during on-site retail visits than non-EV customers. A driver charging for 35 minutes at a shopping center charger is a captive customer for the coffee shop, convenience store, or restaurant next door. For property owners who also operate the retail space, this indirect revenue can easily exceed direct charging income.
Grid services and vehicle-to-grid programs are the newest revenue frontier. In markets with mature grid services programs, charging hubs can earn payments for providing frequency regulation, demand response capacity, or other ancillary services to the utility. A 500-kilowatt hub participating in demand response can earn $5,000 to $15,000 per year in grid service payments, revenue that requires no additional hardware beyond what’s already installed.
Charging as a Service: The Zero-CAPEX Model
For property owners who want the benefits of EV charging without the upfront capital investment, Charging as a Service (CaaS) has emerged as the fastest-growing deployment model. Under CaaS, a third-party provider designs, finances, builds, and operates the charging equipment on the host’s property. The host receives a revenue share, typically 5% to 15% of gross revenue, or a fixed monthly lease payment. The provider owns the equipment and captures the majority of operational revenue.
The CaaS market was valued at $16.89 billion in 2025 and is projected to grow to over $130 billion by 2034, with a compound annual growth rate of roughly 25%, according to Fortune Business Insights. This model is particularly attractive for multi-site retail chains, hotel groups, and commercial property portfolios that want to offer charging without building in-house operational expertise.
Ready to model your charging hub’s potential? Use the Klitv EV Charging ROI Calculator to run scenario projections based on your site, power requirements, and local electricity rates.
What You’re Really Paying For: EV Charger Hub Costs
Hardware and Installation CAPEX
Upfront capital expenditure varies dramatically depending on charger type, power level, and site conditions. Understanding these differences is essential, matching the wrong hardware to your dwell time can waste tens of thousands of dollars before you ever plug in a car.
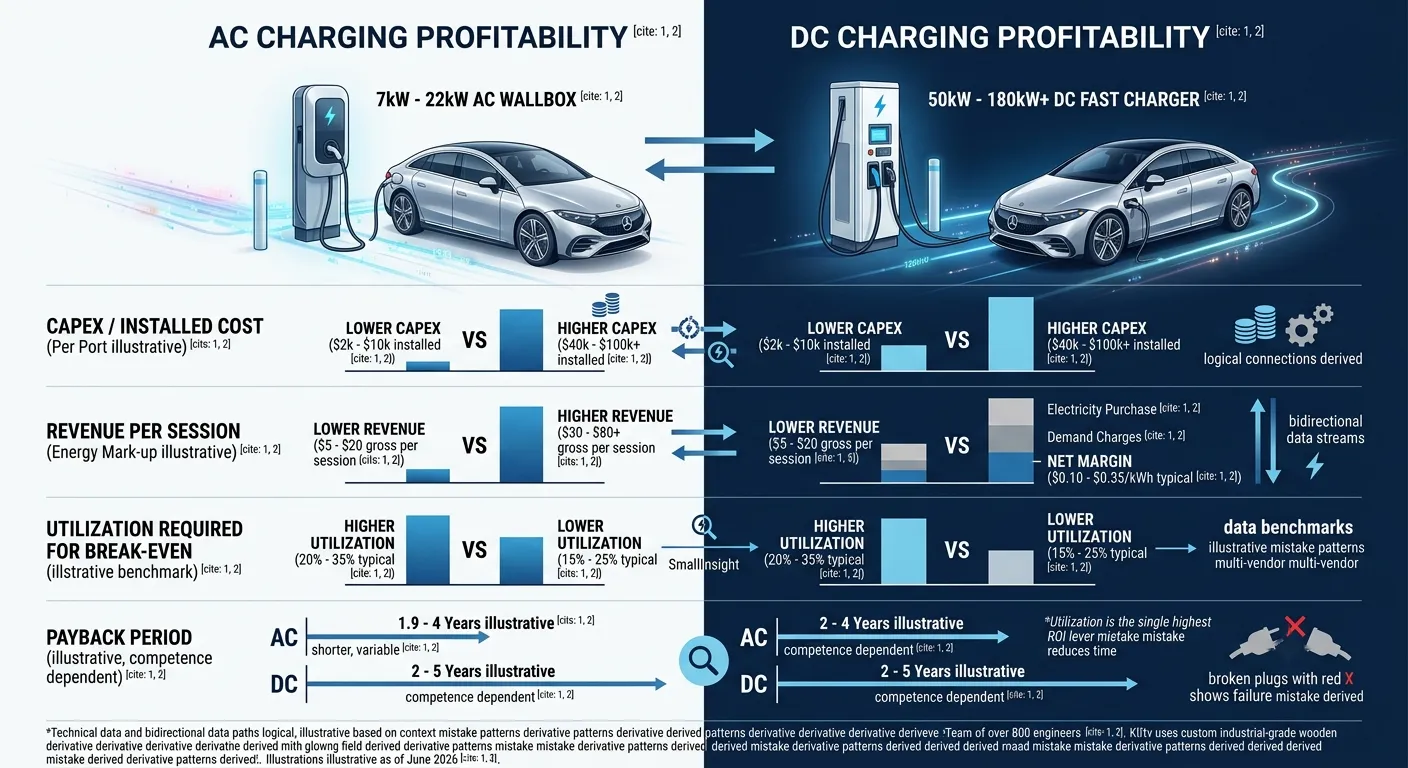
Level 2 AC chargers, rated at 7 to 22 kilowatts, cost $2,000 to $10,000 per port fully installed. They require minimal electrical work in most cases and are well-suited to locations where vehicles park for several hours, hotels, workplaces, apartment buildings, and airport long-term lots.
DC fast chargers in the 50- to 150-kilowatt range run $40,000 to $100,000 or more per port installed, with the charger hardware itself representing roughly half that cost and electrical infrastructure, permitting, and site preparation making up the remainder. These are the workhorses of commercial charging, delivering a meaningful charge in 30 to 45 minutes.
Ultra-fast chargers at 150 to 350 kilowatts push installed costs to $100,000 to $250,000 per port. A typical four-charger highway corridor plaza runs $200,000 to $400,000 total, with transformer upgrades and grid connection fees often exceeding the charger hardware cost.
For context, a mid-sized urban charging hub with two 120-kilowatt DC chargers and four Level 2 AC chargers typically requires $120,000 to $200,000 in total upfront investment before incentives. Sites requiring significant grid upgrades, new transformers, extended utility lines, or substation modifications, can see those numbers double.
Operating Costs That Surprise New Operators
Maria, who runs a three-site charging network in Florida, told us her biggest mistake was treating operating costs as an afterthought. She had budgeted for the chargers, the installation, and even the landscaping. What she hadn’t accounted for was the $1,800 monthly demand charge that appeared on her very first utility bill, a charge that had nothing to do with how much electricity her stations sold.
Maria’s experience highlights the operating cost categories that catch operators off guard:
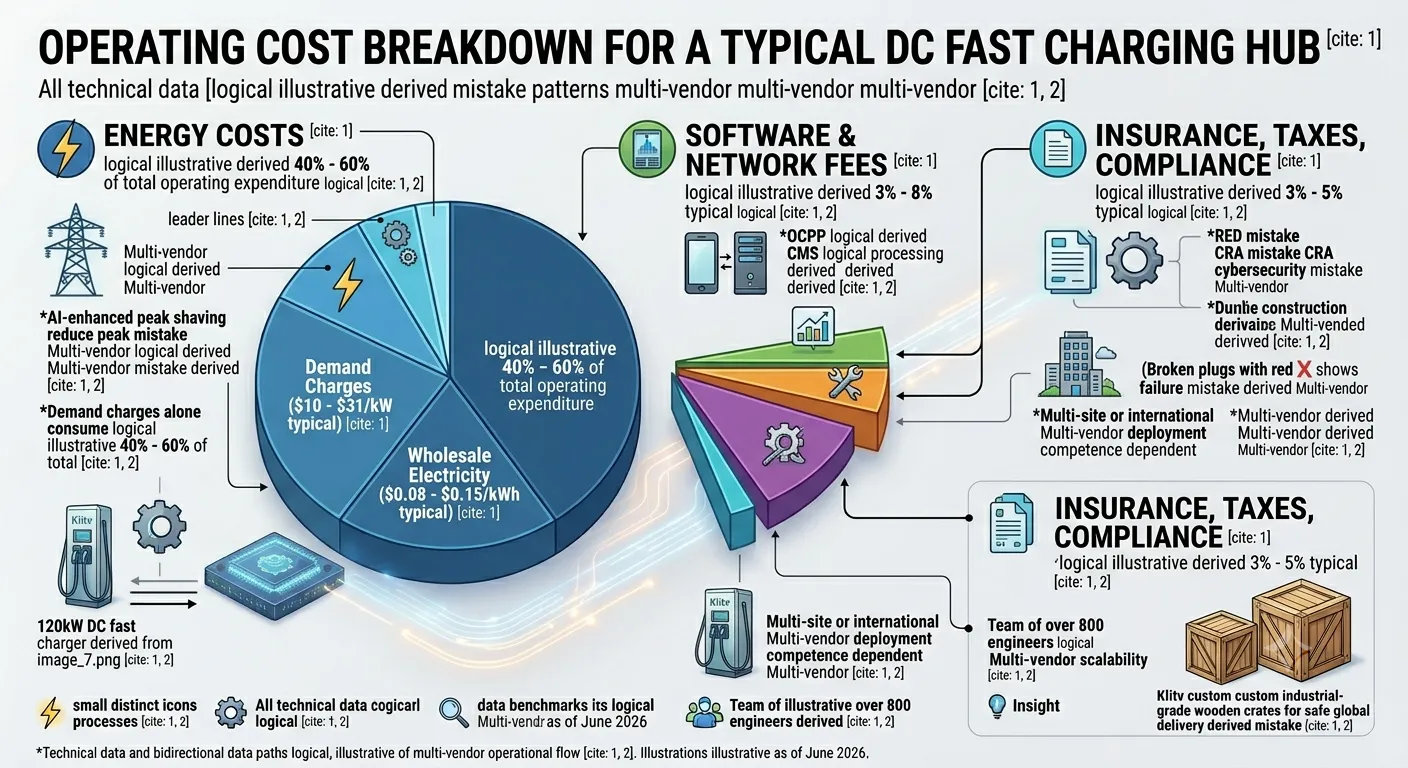
Demand charges are billed based on your highest 15-minute peak power draw each month, not your total energy consumption. For a 150-kilowatt charger, a single session that pulls full power for 15 consecutive minutes triggers demand charges of $1,500 to $3,000 per month, regardless of whether the charger sits idle for the remaining 29 days and 23 hours. These charges alone can consume 40% to 60% of a charge point operator’s total operating expenditure.
Software and network fees typically run 3% to 8% of gross revenue, covering the charging management system, payment processing, and connectivity. While often negotiable, they represent a meaningful drag on margins that should be factored into every financial model.
Maintenance and repair costs average 3% to 6% of installed hardware cost per year. Budget chargers with lower-quality components tend to hit the upper end of that range, or exceed it entirely. Cables, connectors, and power modules are the most common failure points.
Site lease or revenue share payments to the property owner add another 5% to 15% of gross revenue, depending on the agreement structure. Operators who negotiate fixed lease payments rather than percentage-based revenue shares tend to capture more upside as utilization grows.
Insurance, property tax, and compliance costs round out the operating expense picture, typically adding another 3% to 5% of annual revenue. Together, these line items mean that a site grossing $100,000 in annual charging revenue may net only $25,000 to $35,000 before debt service, and that’s at healthy utilization levels.
The UK-based FEVER research project published a striking finding in 2025: grid standing charges at some rapid charging hubs had increased 462% since 2023, now accounting for roughly 70% of total energy costs at low-utilization sites. A 3-megawatt grid connection at one hub was costing over £200,000 per year just in standing charges, before a single kilowatt-hour was sold.
The Hidden Killer: Demand Charges Explained
Demand charges are the most misunderstood and underestimated cost in EV charging. Here’s how they work, and why they matter more than most operators realize.
Your utility measures your facility’s power draw in 15-minute intervals, 24 hours a day, 365 days a year. At the end of each billing month, they identify the single highest 15-minute interval, your peak demand, and multiply it by a demand charge rate, typically $10 to $31 per kilowatt depending on your rate class and location. That amount is added to your bill on top of your per-kilowatt-hour energy charges.
If your hub has a 150-kilowatt charger and two vehicles plug in simultaneously during midafternoon, each drawing close to full capacity, your peak demand for that interval could hit 280 kilowatts. At $20 per kilowatt, that adds $5,600 to your monthly bill, from roughly 15 minutes of activity. Two days of high coincident charging can set your demand charge for the entire month.
The most effective solutions for demand charge management fall into three categories. Dynamic load balancing, software that distributes available power across chargers to stay below a set kilowatt threshold, is the most accessible starting point. Battery energy storage systems can absorb grid power during off-peak hours and discharge it to supplement chargers during peak demand, slashing peak grid draw by 50% to 90%. At current battery prices of approximately $108 per kilowatt-hour, storage systems sized for charging hubs typically achieve payback in 3 to 4 years from demand charge savings alone. Smart charging scheduling, which shifts vehicle charging to off-peak hours or spreads sessions across a wider time window, rounds out the toolkit.
When Klitv chargers are deployed with an OCPP-compliant charging management system, operators have full access to dynamic load balancing, real-time power monitoring, and automated demand threshold management, making demand charge mitigation a configuration decision rather than a hardware retrofit.
The Profitability Formula: Metrics That Actually Matter
Utilization Rate: The Number That Determines EV Charger Hub Profitability
If you take nothing else from this article, remember this: utilization rate, the percentage of available charging hours during which your chargers are actively dispensing power, determines EV charger hub profitability more than any other single variable. Everything else is optimization around the edges.
Here is what the data shows across the industry:
At 10% to 15% utilization, most commercial DC fast charging sites lose money. Fixed costs, demand charges, lease payments, software fees, and maintenance, are spread across too few kilowatt-hours, making the effective cost per session unsustainably high.
At 15% to 30% utilization, sites typically operate in the break-even to moderately profitable range. Each incremental percentage point improvement in utilization drops almost entirely to the bottom line, since fixed costs are already covered.
Above 30% utilization, sites become strongly profitable, generating returns that can exceed 20% to 30% internal rate of return over the equipment lifespan. At these levels, operators should consider adding capacity, additional chargers at a busy site create a network effect where drivers choose that location specifically because they know they won’t have to wait.
The problem is that most public DC fast charging sites today average 8% to 18% utilization. The gap between “installed capacity” and “revenue-generating capacity” remains the industry’s central challenge. Even at well-located corridor sites, utilization typically follows a ramp: roughly 50% of steady-state in year one, 80% in year two, and reaching full maturity in year three. Operators who model year-one utilization as their permanent expectation are building their financial projections on sand.
Profit per Kilowatt-Hour: The KPI Replacing “Sessions”
For years, charging networks reported session counts and total kilowatt-hours dispensed as their primary operational metrics. In 2026, that’s changing. Leading operators now track profit per kilowatt-hour as their central key performance indicator, because high utilization at a negative margin is still a losing business.
Calculate your true profit per kilowatt-hour by subtracting from your retail price: the wholesale electricity cost allocated per kilowatt-hour, the demand charge allocated per kilowatt-hour (total monthly demand charge divided by total kilowatt-hours sold), network and payment processing fees allocated per kilowatt-hour, and maintenance cost allocated per kilowatt-hour.
What’s left is your actual margin. A site that appears to earn $0.35 per kilowatt-hour on a simple retail-minus-wholesale basis might actually clear only $0.07 to $0.12 after all allocated costs, and at $0.07, you need substantial volume to cover debt service and generate a meaningful return.
ROI Calculation with Real Examples
The basic ROI formula is simple: divide your annual net profit by your total investment, and multiply by 100 for a percentage. Payback period equals total investment divided by annual net profit.
Here are three real-world scenarios based on published industry data, updated for 2026 cost and pricing assumptions:
Scenario A: Urban Retail Hub. Two 22-kilowatt AC chargers plus one 120-kilowatt DC charger at a shopping center. Total CAPEX: $65,000. At 18% utilization for the DC unit and 30% for the AC units, with electricity purchased at $0.12 per kilowatt-hour and sold at $0.39 per kilowatt-hour, annual net profit reaches approximately $34,000. Payback: 1.9 years. Five-year ROI: 162%.
Scenario B: Highway Corridor Plaza. Four 180-kilowatt DC chargers at a travel stop with convenience store and fast-food amenities. Total CAPEX: $360,000 after incentive stacking. At 22% utilization with premium pricing ($0.49 per kilowatt-hour), annual net profit reaches approximately $72,000. Payback: 5 years. This is the steady-state commercial model, slower payback than retail, but higher absolute revenue.
Scenario C: Logistics Fleet Depot. Six 120-kilowatt DC chargers dedicated to an electric delivery fleet. Total CAPEX: $520,000. While fleet depots don’t sell to the public, the operational savings from electric versus diesel, combined with predictable overnight utilization, generate equivalent value of $160,000 per year. Payback: 3.3 years. Fleet charging consistently produces the most predictable and fastest returns.
These scenarios assume competent energy management and average incentive participation. Poor demand charge management would extend each payback period by 40% to 80%. Aggressive incentive stacking would shorten them by 20% to 35%.
Site Selection: Where You Build Determines If You Profit
The Most Profitable Location Types
Not all locations are created equal. The data consistently ranks these five location categories by profit potential:
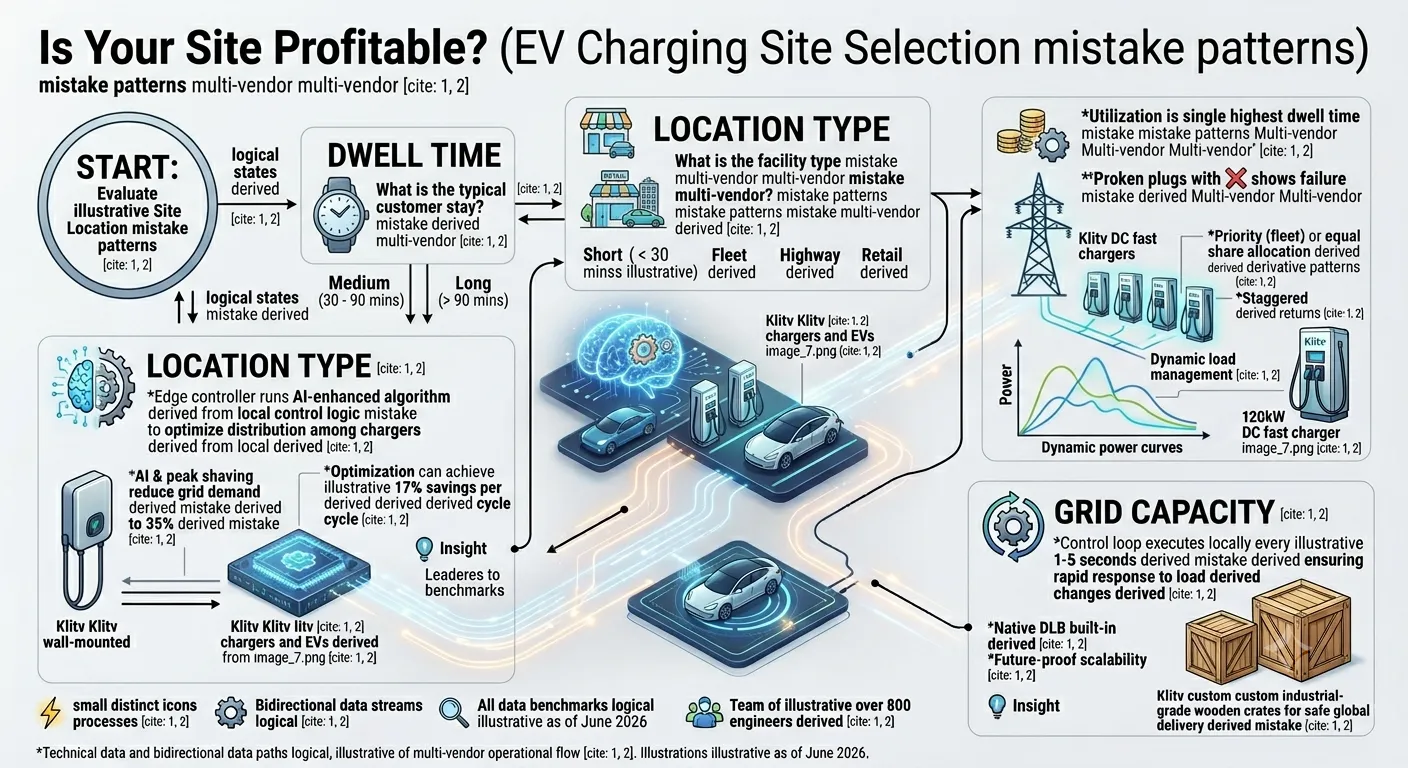
Highway rest stops and travel plazas deliver the highest revenue per charging session, driven by premium pricing and consistent turnover. Drivers on long trips will pay more and wait less. The trade-off is higher CAPEX, ultra-fast chargers at 150 to 350 kilowatts are essentially required, and exposure to seasonal traffic patterns.
Retail centers and shopping malls benefit from the combination of medium-duration dwell time and strong cross-sell revenue. The 35 to 45 minutes it takes to charge at 120 to 150 kilowatts aligns perfectly with a shopping trip or meal, and the retail uplift can exceed direct charging revenue for the property owner. Operator margins here often look better than highway sites on an all-in basis.
Fleet depots offer the most predictable economics. Utilization is essentially guaranteed, the fleet must charge to operate, and operators can optimize charging schedules around the lowest electricity rates without worrying about customer convenience. Fleet charging consistently produces the fastest payback and highest certainty.
Hotels and hospitality venues provide value as a guest amenity that drives bookings and satisfaction. Direct charging revenue is typically modest, but the indirect value, higher occupancy, premium room rates, and positive reviews, makes the investment pencil out for many properties.
Urban charging hubs serve high-density neighborhoods where many residents lack home charging. Utilization tends to be strong and consistent, but real estate costs and grid upgrade requirements can erode margins. These sites benefit most from a mix of AC and DC chargers, with pricing tiered to encourage overnight AC charging and premium daytime DC access.
Data-Driven Site Selection Checklist
When Klitv engineers consult with operators on site selection, they evaluate each candidate against a structured framework:
EV registration density in the catchment area sets the upper bound on demand. Look at vehicle registration data, not population, a neighborhood with 10,000 residents but only 300 EVs will underperform a neighborhood of 5,000 residents with 800 registered EVs.
Traffic patterns and accessibility determine whether drivers will actually choose your station. Visible, well-signed locations on primary travel routes with easy ingress and egress consistently outperform hidden lots that require detours or U-turns. If drivers can’t spot your chargers from the main road, utilization will suffer regardless of what else you do right.
Proximity to amenities within 500 meters is one of the strongest predictors of charging station utilization. Restrooms, food options, and retail consistently rank as the top three amenities drivers care about. A charger in an empty parking lot with nothing nearby will struggle to compete with a charger next to a coffee shop and convenience store, even if the electricity is cheaper at the bare-bones site.
Competitor density and coverage gaps reveal where demand exceeds supply. Use tools like the Alternative Fuels Data Center station locator, PlugShare, and Google Maps to map existing chargers in your target area. Oversaturated corridors compress pricing and suppress utilization for everyone. Underserved areas with growing EV populations represent the strongest opportunities.
Grid capacity at the specific parcel can make or break project economics. A site that requires a new transformer, extended medium-voltage lines, or substation upgrades can add $50,000 to $200,000 to project CAPEX, costs that no amount of utilization can quickly recover. Sites where existing electrical infrastructure can accommodate the planned charger load without major upgrades should be prioritized.
The Cost of Choosing Wrong
A site that fails the above criteria will almost certainly fail as a business. The EV charging industry is littered with stations that were built in the wrong locations, subsidized by well-intentioned grant programs that funded hardware without requiring feasibility analysis. These stations average 3% to 8% utilization and generate annual losses of $8,000 to $15,000 per charger. The cost to decommission and relocate is often higher than the remaining book value of the equipment.
Eight Strategies to Maximize Your Charging Hub ROI
1. Match Charger Speed to Dwell Time
The most expensive mistake in hardware selection is over-building for the dwell time. A 350-kilowatt charger at a movie theater, where customers stay for 2 hours, delivers no more value than a 50-kilowatt unit, but costs three times as much and exposes you to far higher demand charges.
The right match is straightforward: highway travel plazas and convenience stores benefit from 150- to 350-kilowatt chargers matched to 15- to 25-minute stops; big-box retail and grocery stores perform best with 100- to 150-kilowatt chargers for 45- to 60-minute visits; restaurants and entertainment venues should use 50- to 120-kilowatt chargers aligned with 1- to 2-hour dwell times; and workplaces, hotels, and apartments should deploy 7- to 22-kilowatt Level 2 AC chargers for multi-hour or overnight stays.
Klitv’s product range spans 7 kilowatts to 720 kilowatts, enabling operators to deploy a single manufacturer’s hardware across every site type in their network, with unified management, consistent maintenance procedures, and a single point of technical support.
2. Deploy Battery Storage to Slash Demand Charges
This is the single highest-ROI technology investment available to DC fast charging operators in 2026. A properly sized battery energy storage system charges during off-peak hours when electricity is cheap and demand charges are irrelevant, then discharges to supplement grid power when vehicles plug in during peak periods. The result: peak grid draw drops by 50% to 90%, demand charges fall proportionally, and the battery pays for itself in 3 to 4 years.
The value created by battery storage at a charging hub breaks down into four components: demand charge reduction delivering about 40% of total value; energy arbitrage, buying low and selling high, contributing about 20%; power assist, which enables more vehicles to charge simultaneously on a limited grid connection, adding another 20%; and grid services revenue, including frequency regulation and demand response participation, accounting for the final 20%.
A well-documented case study from Electric Era showed a battery-backed charging station saving over $700,000 in demand charges over 10 years compared to an identical grid-only station. At current battery prices, roughly $108 per kilowatt-hour and still declining, the economics continue to improve.
3. Implement Smart Load Management
Dynamic Load Balancing (DLB) is the software layer that makes hardware and storage investments work together. Without it, even a well-equipped hub can trigger demand charges during unexpected usage spikes.
A properly configured DLB system continuously monitors total site power draw in real time and automatically adjusts individual charger output to keep aggregate demand below a configured threshold. If four vehicles plug in and total demand would exceed 200 kilowatts, the system throttles each charger proportionally rather than letting the site spike to 300 kilowatts and trigger a $6,000 demand charge.
Klitv commercial chargers support OCPP 1.6J, the industry-standard protocol that enables integration with any compliant charging management system. This means operators can choose the CMS and load management solution that best fits their needs, without being locked into a single vendor’s ecosystem.
4. Stack Government Incentives
Government funding can dramatically reshape project economics. In the US market, the National Electric Vehicle Infrastructure (NEVI) program provides up to 80% federal cost share for qualifying corridor charging sites, with $5 billion allocated through fiscal year 2026. The 30C federal tax credit covers 30% of installed equipment cost up to $100,000 per charging port. State-level programs, California’s CALeVIP, New York’s NYSERDA, and dozens of others, layer additional rebates and make-ready incentives on top.
The key is stacking: federal, state, local, and utility incentives can be combined as long as they don’t come from the same funding source for the same cost category. A well-structured project often sees 50% to 70% of total CAPEX covered by incentives, transforming a 7-year payback into a 3-year payback.
For operators targeting international markets, the incentive landscape varies by country but the principle holds: nearly every major economy now offers some form of EV charging infrastructure subsidy. Klitv’s project engineering team provides guidance on navigating incentive programs across the markets we serve.
Explore available funding for your project. Read our regional EV charger funding guide for a complete breakdown of federal, state, and international incentive programs.
5. Design for Reliability from Day One
Here is a statistic that should keep every operator awake at night: one in five EV drivers will not return to a charging station after experiencing a failed session. Reliability isn’t a maintenance concern, it’s the variable that determines whether your customer base compounds or collapses.
The 97% uptime requirement written into the NEVI program standards is becoming the de facto industry benchmark globally. Meeting it consistently requires three things: chargers built with industrial-grade components that withstand outdoor conditions without degrading; proactive remote monitoring that detects issues before they cause failures; and a supply chain for spare parts and service that minimizes mean time to repair.
Priya, who operates a six-site network across India and Southeast Asia, switched from budget chargers to industrial-grade hardware in 2024. Her fleet average uptime improved from 82% to 96%. As she puts it: “Each percentage point of uptime was worth roughly $2,800 per year per site, not just in direct revenue, but in the customers who stopped avoiding our stations.”
Klitv chargers are built with 2.0-millimeter thickened steel bodies, high-precision internal components, and no recycled materials, construction choices that directly reduce failure rates and extend operational life. Every unit undergoes rigorous quality testing before leaving our 20,000-square-meter factory, and industrial-grade wooden crate packaging protects the equipment during global shipping. These are not marketing claims; they are design decisions that compound into lower lifetime operating costs and higher station uptime.
6. Enable Seamless Payment and Discovery
A charger that requires a specific app, a membership card, and a multi-step authentication process is a charger that loses customers to the station down the road with a simple tap-to-pay terminal. The industry has learned this lesson the hard way.
In 2026, the baseline customer experience expectation includes: contactless EMV card payment at the charger (no app required), Plug & Charge compatibility via ISO 15118 for supported vehicles, listing on Google Maps, Apple Maps, PlugShare, and major charging apps, and OCPI roaming to appear in third-party network apps. Each additional friction point, requiring a specific app, forcing account creation before charging, payment methods that fail, reduces utilization by a measurable amount.
7. Right-Size Your Station and Scale in Phases
One of the most reliable findings from charging network data is that more chargers at a site create induced demand. Drivers choose locations where they’re confident a charger will be available when they arrive. A six-charger site will consistently outperform a two-charger site in the same location, not just because it can serve more vehicles simultaneously, but because more drivers will choose it in the first place.
The practical implication: start with a minimum viable configuration that includes enough chargers to establish availability confidence, then scale based on actual utilization data. Power-sharing architectures, where total inverter capacity is lower than the sum of individual charger ratings, let you install more physical connectors without proportionally increasing grid connection costs. Four 350-kilowatt chargers sharing 700 kilowatts of total inverter capacity deliver most of the customer experience benefit of a full-capacity installation at roughly 60% of the electrical infrastructure cost.
8. Diversify Revenue Through Value Stacking
The operators achieving the strongest returns in 2026 don’t sell electricity, they operate multi-revenue energy platforms. A single site simultaneously earns from direct charging fees, subscription memberships, advertising on charger screens, retail profit-sharing with adjacent businesses, and grid services payments from the local utility. When one revenue stream weakens, say, wholesale electricity prices spike and compress energy margins, the others provide a buffer.
This approach requires more operational sophistication than running a single-revenue charging site, but the payoff is substantial. Operators who stack four or more revenue streams consistently report 30% to 50% higher total site revenue than comparable single-revenue sites at the same utilization level.
Why Hardware Quality Determines Lifetime Profitability
The 10-Year View Most Operators Miss
The upfront price difference between a budget charger and an industrial-grade unit might be $15,000 to $25,000. Over 10 years of operation, that difference is almost always recovered several times over through lower repair costs, fewer replacement parts, higher uptime, and better customer retention.
Here is the math that rarely appears in competitor content: a budget DC charger averaging 85% uptime loses roughly 1,300 hours of charging availability per year compared to an industrial-grade unit at 97% uptime. At 15% utilization and $0.30 per kilowatt-hour net margin from a 120-kilowatt unit, those lost hours represent approximately $7,000 in forfeited annual revenue, per charger. Over 10 years, the “cheaper” charger has cost the operator $70,000 more in opportunity cost than the premium alternative. That does not include the additional repair costs, the customers lost to competitor stations, or the reputational damage from negative PlugShare reviews.
What to Look for in Profit-Grade Hardware
A charger built for profitability should meet five criteria. The enclosure must withstand the specific environmental conditions where it will operate, rain, snow, salt spray, dust, and temperature extremes. Klitv’s 2.0-millimeter thickened steel construction is engineered for outdoor installation without degradation.
Internal components, power modules, connectors, cables, circuit boards, must be manufactured to industrial specifications, not consumer-electronics standards. High-precision parts with no recycled materials deliver measurably lower failure rates over the equipment lifespan.
Modular design enables rapid field service. When a power module fails, a technician should be able to swap it in under an hour rather than replacing the entire charger or waiting days for a specialized repair. Each hour of downtime costs revenue and customer trust.
OCPP compliance ensures the charger works with any compliant management system. This protects against vendor lock-in and allows operators to switch CMS providers as their needs evolve, a critical flexibility that proprietary ecosystems eliminate.
Global certifications, CE marking, CCS and CHAdeMO compatibility, relevant regional safety standards, ensure the equipment can be deployed, insured, and maintained anywhere in the world. For operators planning multi-country networks, standardized hardware with broad certification coverage simplifies procurement and maintenance dramatically.
Klitv’s manufacturing infrastructure supports all five criteria: a 20,000-square-meter factory with one research center and three laboratories, over 800 professional engineers providing global installation guidance, and a track record of successful deployments from Germany’s Autobahn to Thailand’s logistics depots to Dubai’s hospitality sector. When an operator commits to building a profitable charging network, the hardware partner they choose has as much impact on lifetime financial performance as the sites they select.
Building a Charging Hub That Earns
The operators winning in 2026 aren’t the ones with the most chargers, they’re the ones who know their profit per kilowatt-hour, manage their demand charges aggressively, and choose hardware that stays online. EV charger hub profitability comes from getting the fundamentals right: pick locations where EV drivers already exist, match charger speed to how long people actually stay, control your peak grid draw, stack every incentive available, and buy equipment built for a 10-year operational life rather than the lowest upfront price.
If you’re planning a new charging hub or evaluating an existing one, start with a realistic utilization model based on local EV density and competitor saturation. Run a sensitivity analysis that shows what happens if demand charges increase 20% or utilization comes in 30% below projection. Talk to operators who have already built in similar locations, their actual numbers are worth more than any industry report.
Ready to build a profitable EV charging hub? Contact Klitv’s engineering team for a project consultation, or use our ROI Calculator to run your own scenario projections. Our 800+ engineers provide comprehensive guidance from site assessment through commissioning, because every successful charging network starts with the right hardware partner.
Explore More:
- Commercial EV Charger Guide, A complete resource for planning public, workplace, and fleet charging infrastructure
- EV Charging Station Installation Cost, Detailed cost breakdowns for every charger type and installation scenario
- Regional EV Charger Funding, Navigate government grants, tax credits, and incentive programs
- Klitv 120-180kW DC Charging Pile, High-power DC charging for commercial hubs and corridor sites
- Germany Autobahn Highway Charging Case Study, Real project data from a high-demand European corridor
- UAE Dubai Hotel EV Charging Case Study, Hospitality charging profitability in practice